Setting-up Sitecore Analytics Dashboard part 2: A configuration with obstacles
Welcome to the second part of my self-attempt to use the Sitecore Analytics Dashboard. As a reminder: The purpose is to bring the Sitecore Analytics Widget on my launch pad to life. Though it is displayed, no data or graphics are visible and it’s completely empty.
Trying to solve this problem, during the first part of this blog I have started by dealing with the core of the analytics world in Sitecore, the Experience Database (short: xDB). Here, we have the NoSQL data base MongoDB. In this context I could only identify that apparently no Analytics data is saved. Not even the Experience Analytics dashboard is displaying any data. And that’s the present situation.
The next step
As usual, the way to solve a problem is Google. I tried the following search request:
„sitecore experience analytics not working“
The result is sparse and doesn’t help me at all.
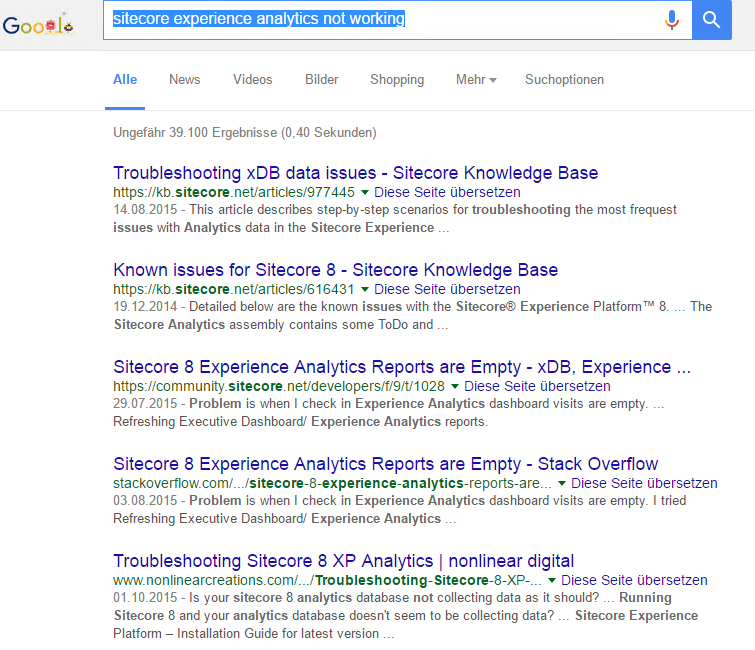
At least I realize that I’m not alone. A cheer for the Internet and all the helpless and desperate, who (like myself) don’t want to keep searching for the cause of a problem alone anymore. But seriously, in case of a problem the first place to go would be the fantastic Sitcore Support. But since I’m on my own Sitecore playground, I try to ignore this idea and attempt to find a solution on my own. Just like the advice I already received from Sitecore at the end of the first part of this post:
„Contact YOUR system administrator“
Data bank access
Before taking advantage of the Google results or Sitecore Support or bothering the Admin, I double check access to the data bank through the Sitecore System. The configuration for this can be found in the catalogue „App_Config\Include“ and is called „Sitecore.Analytics.MongoDb.config“. The content looks like this:
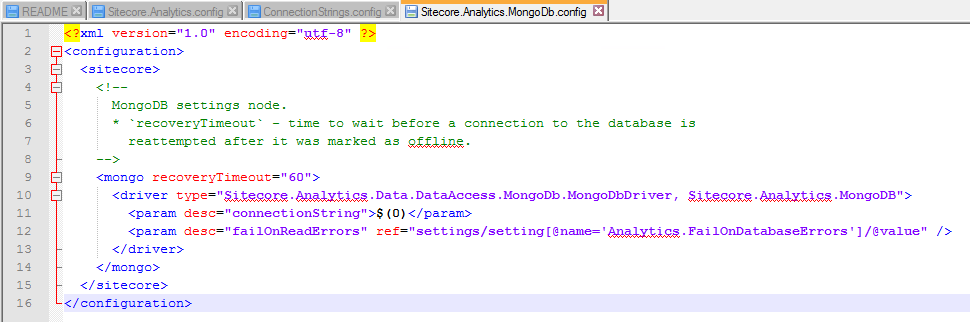
Connection String
Within the configuration you can see that there is a placeholder „$(0)“ for the value of the parameter „connectionString“. Since this is only the configuration for the MongoDB data bank driver, it will most likely be filled with a value when creating a connection to a specific scheme. But where is this coming from? Maybe from the configuration file „ConnectionStrings.config“? At least that’s where the corresponding connecting data is located:
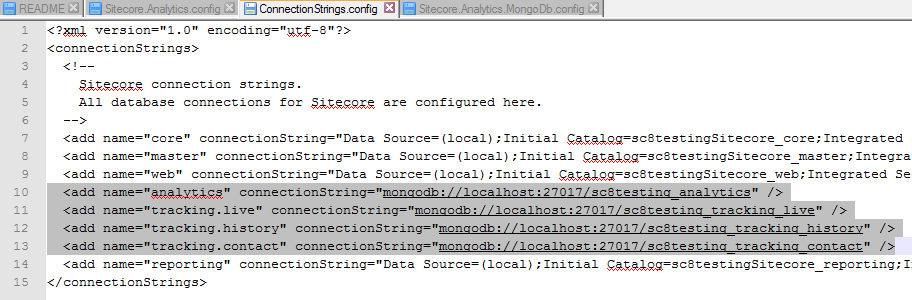
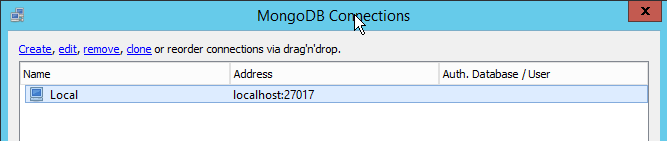
Robomongo
Trying this connection string individually would be far too laborious. There are no user names or passwords used and the connection works just as well with my MongoDB client „Robomongo“:
MongoDB Windows-Service
So the connection seems to work. One more look at Windows service: Is it running? What is the start type?
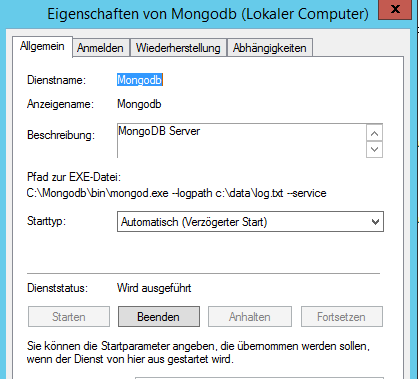
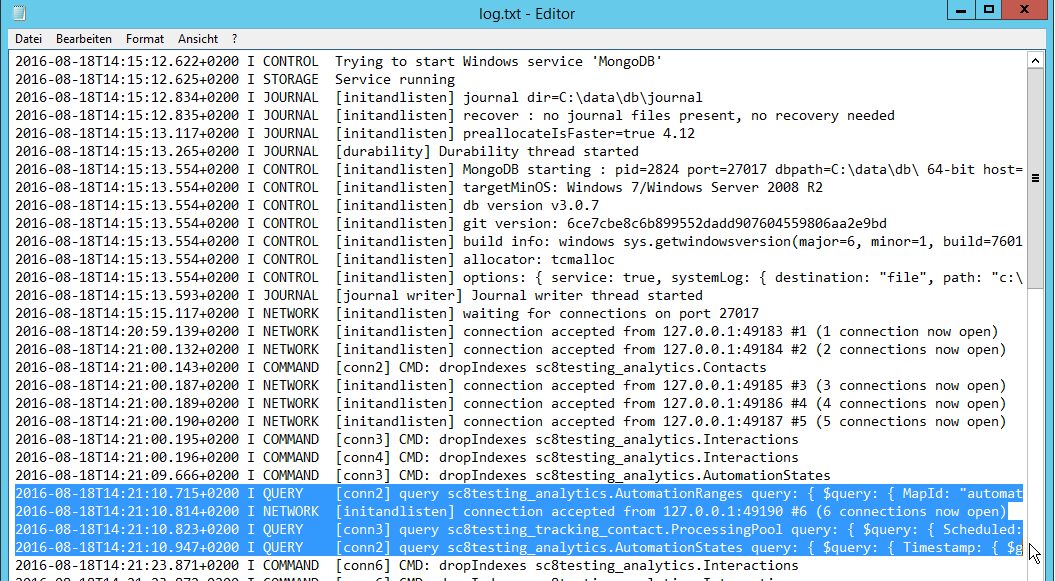
MongoDB Log.txt
After coming to the conclusion that everything is okay with the service configuration, the „logpath“ parameter catches my attention. This is part of „mongodb.exe“ when starting. Now I just have to take a look at the log file to see if there is anything unusual going on there. But on the contrary: connections are being made and requests are carried out. So apparently file reading is working:
Back to Google
Based on what has been achieved so far I turn my attention back to Google: How can I get data to be displayed on my Sitecore Analytics Widget?
In order to find a matching entry you have to search a little. In community forums users often misunderstand each other. Unnecessary server configurations are requested and well-meant solutions chipped in for completely different problems. After reading for hours you are as helpless as before. At some point though, I finally come across something useful: One person asks a question and another one gives a well-informed answer, which the asking-person highlighted as the solution for the problem. Example: Stackoverflow. Nevertheless, with this process you run the risk of not knowing, which code you have copied into your application. So, the decision which solution you are going for in the end is directly related to the amount of time you have available and your resilience.
Sitecore Knowledge Base
The step-by-step solutions mentioned here are rather trivial and perfunctory. They simply cover very basic error causes like accessibility of the data base (works for me), checking firewall settings (which I have turned off) and checking ASP session settings. https://kb.sitecore.net/articles/977445
Sitecore Community
At https://community.sitecore.net/developers/f/9/p/1028/3528#3528 you can find the typical absurd suggestions for trouble shooting. And I simply refuse to believe that I have to take care of these kinds of things myself with a CMS system of this price range in order to get standard functions to work. This includes the demand by user Sergey to just post the configuration:
„Are you getting any errors in the log files? Can you share your connectionstrings in connectionstring.config file“
What the hell does Sergey want the connection data for? Try if they work for him? Long-distance diagnosis via transcendental remote connection? The comment highlighted as the answer is a rather absurd tutorial. But at least parts of it are useful:
Thanks, Sergey! After all: The segment thing makes sense, especially if they are missing. So, I check it via SQL Management Studio. And indeed: The chart is empty.
From the Sitecore Documentation I learn that this is normal and that the segments still have to be deployed after the installation. For a moment I am tempted to run a Sitecore Upgrade in order to escape all of this. But after quickly scanning the Sitecore Upgrade instructions I remember that this is not the best way to go. At least not in this context.
Another useful hint is a link to the administration page: sitecore/admin/redeploymarketingdata.aspx
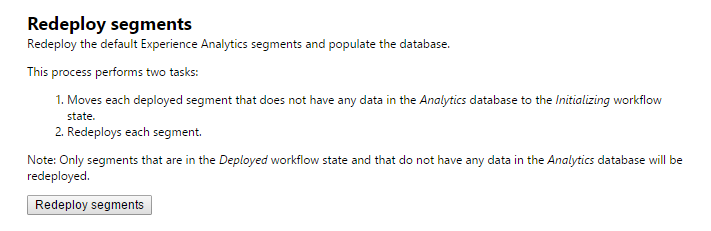
So I click on it and get response to the installed segments. Another look at the corresponding SQL chart proofs: It worked and it isn’t empty anymore. The control panel reachable from the launch pad offers an overview of the analytics status:
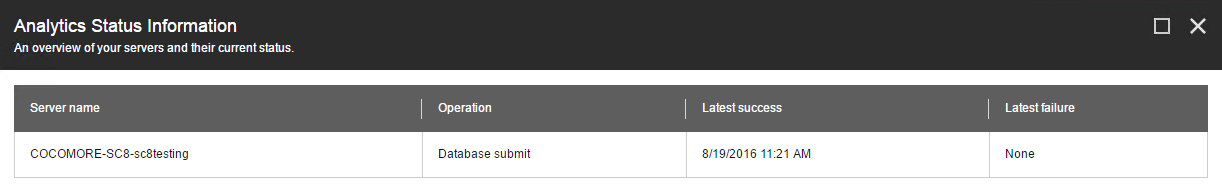
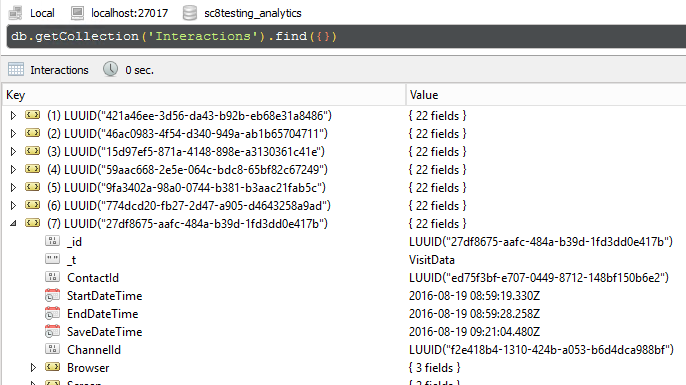
Looking good. And a glance at my MongoDB shows that there is current data:
Filled with excitement I return to the analytics dashboard. But here I have to make the sobering realization that there is no real-time view and no data prior to yesterday be displayed. Basically like Google analytics, but at least there you have the option to “follow” website visitors in real-time. Bummer. At least I don’t get an error message anymore (see graphic two). Apart from all, this leaves me mildly optimistic.
On the finishing straight
When taking detours you can see more of the landscape (and why should everything always work right away) but now I want to return to my actual task and see analytics data on my Launchpad. But a little research leads to a sobering realization. We recall the description of the placeholder in the Launchpad:
„Sitecore XP 8.0 enables you to configure this dashboard to show the most important analytics graphs every time you come back to the Launchpad. Use this space to keep on top of the metrics most important to your organization. “
Forget it. There is nothing to configure. Not even with your own CMS means by Sitecore, Content Editor or Experience Editor, the placeholder can be filled accordingly. You need “Visual Studio”, and since the Launchpad is a SPEAK-surface, even “Sitecore Rocks”. So, if you want to spend more time on this topic, I recommend a Google search for „sitecore launchpad analytics“.
Reading the manual may be helpful. By doing so the basic problem with saving the analytics data wouldn’t even have occurred. That was my mistake. BUT: Sitecore can’t keep the promise of being able to configure an Analytics Dashboard for your Launchpad real quick. In reality, the way to get there is only possible by working with developers. As there are mainly people from the marketing department being interested in such data and Sitecore has dedicated itself to this topic explicitly, this is a clear drawback.
With the topic Analytics in general I am missing the view in real-time and options to see data within the application as well. As compared to preview mode of Google Tag-Manager.
Our expert

Miklas Bieberstein
Miklas Bieberstein works as a Software Developer, Techlead Sitecore and .NET, at Cocomore since April 2013. Bevor he worked as a Software Developer in the finance sector. At Cocomore he especially appreciates the responsibility, flexibility and creativity. What luck, that he describes himself exactly like this: responsible, flexible and creative.
Any questions or input? Reach out to our experts!


